

© 2026 Rooted Rock Marketing. All rights reserved. This report may be shared with proper attribution. Please cite and link to the original source.
The Simpleview Visibility Study
How 100 Destination Websites Perform in Organic Search and AI Discovery
Introduction & Purpose
Simpleview Introduction
Simpleview powers thousands of websites used by destination marketing organizations (DMOs) throughout the country. Entities ranging from major state tourism boards to small regional DMOs use Simpleview for their web presence.
These sites typically share a common architecture, with listing pages that describe local businesses and attractions, event pages covering both one-time and recurring events, and supporting editorial blog content alongside standard site pages.
Purpose
We analyzed 100 Simpleview-built DMO websites across a diverse range of geographic areas and market sizes to understand how the Simpleview site architecture translates into real-world search performance.
The findings were, in many cases, unambiguous and surprising. Results also point to clear opportunities for DMOs looking to improve their digital visibility.
Research
Questions We Asked
- How much traffic do listings actually generate?
- What role do blog pages play in online visibility?
- How visible are Simpleview sites to AI-driven search tools?
- Does market size determine success, or does strategy play a bigger role?
Key Findings
-
1
Nearly 3 in 10 listing pages receive zero organic traffic — that's 28.7% of 161,307 pages analyzed across all 100 sites. This pattern holds across every tier, from the largest state DMOs to the smallest regional destinations.
-
2
Listings make up more than half of all pages on a typical Simpleview site, but generate less than a quarter of organic traffic. The content architecture and the traffic reality are seriously misaligned.
-
3
The average AI Visibility Score across 100 DMOs was 28.1 out of 100. While AI search is still emerging as a strong driver of travel query traffic (only 1.3% of destination searches even trigger an AI Overview), the gap between leaders and laggards is already significant, with scores ranging from 15 to 49.
-
4
86 out of 100 DMO sites have Facebook appearing among the top co-cited sources in AI search results, alongside TripAdvisor (79 of 100) and YouTube (39 of 100).
-
5
Market size matters … a little. The size of a destination's geographic market explains only 10.6% of the variation in traffic across the sites studied. The correlation between metro area population and organic traffic is just r = 0.33.
None of these findings reflect a platform problem. Simpleview provides the infrastructure. What the data points to, consistently, is a content strategy gap.
The Listings Paradox
More Pages Can Mean Less Traffic
Listings: The Structural Foundation of a Simpleview Site
Listings represent all DMOs' partners: the hotels, restaurants, attractions, and experiences that attract visitors to a destination. Across 100 sites, listings accounted for more than half of all pages in this study.
We analyzed 161,307 listing pages in total, which averaged 1,613 listings per site — all sites but one analyzed incorporated dedicated listing pages.
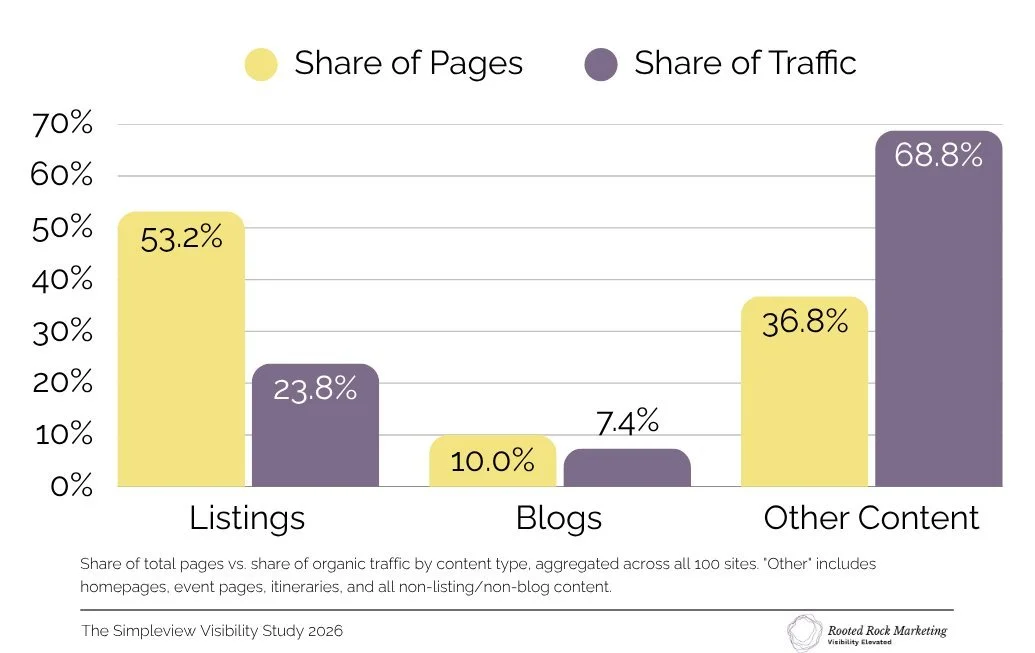
Pages vs. Traffic: A Significant Imbalance
Listings make up 53.2% of pages on a typical Simpleview site, but generate only 23.8% of organic traffic. The majority of search performance comes from non-listing content — blogs, homepages, editorial guides, event pages, and other sections that represent 36.8% of pages but deliver 68.8% of traffic.
Nearly 3 in 10 Listing Pages Get No Organic Traffic
Across the dataset, 28.7% of listing pages receive zero organic traffic — 46,310 pages out of 161,307 are completely invisible in search. This is not just a problem with small markets or websites, nor a data anomaly. It is a consistent pattern across every market tier.
On a site with 1,000 listings — close to the median in this study — roughly 287 partner pages contribute nothing to organic visibility. For DMOs that depend on listing pages to drive partner value, this gap deserves serious attention.
The strong performance of 'Other Content' — which includes main site pages, event pages, guides, etc. — reflects the value of non-templated, destination-specific pages that are often built with more intentional SEO and content strategy than partner listing pages and are outside the scope of this study.
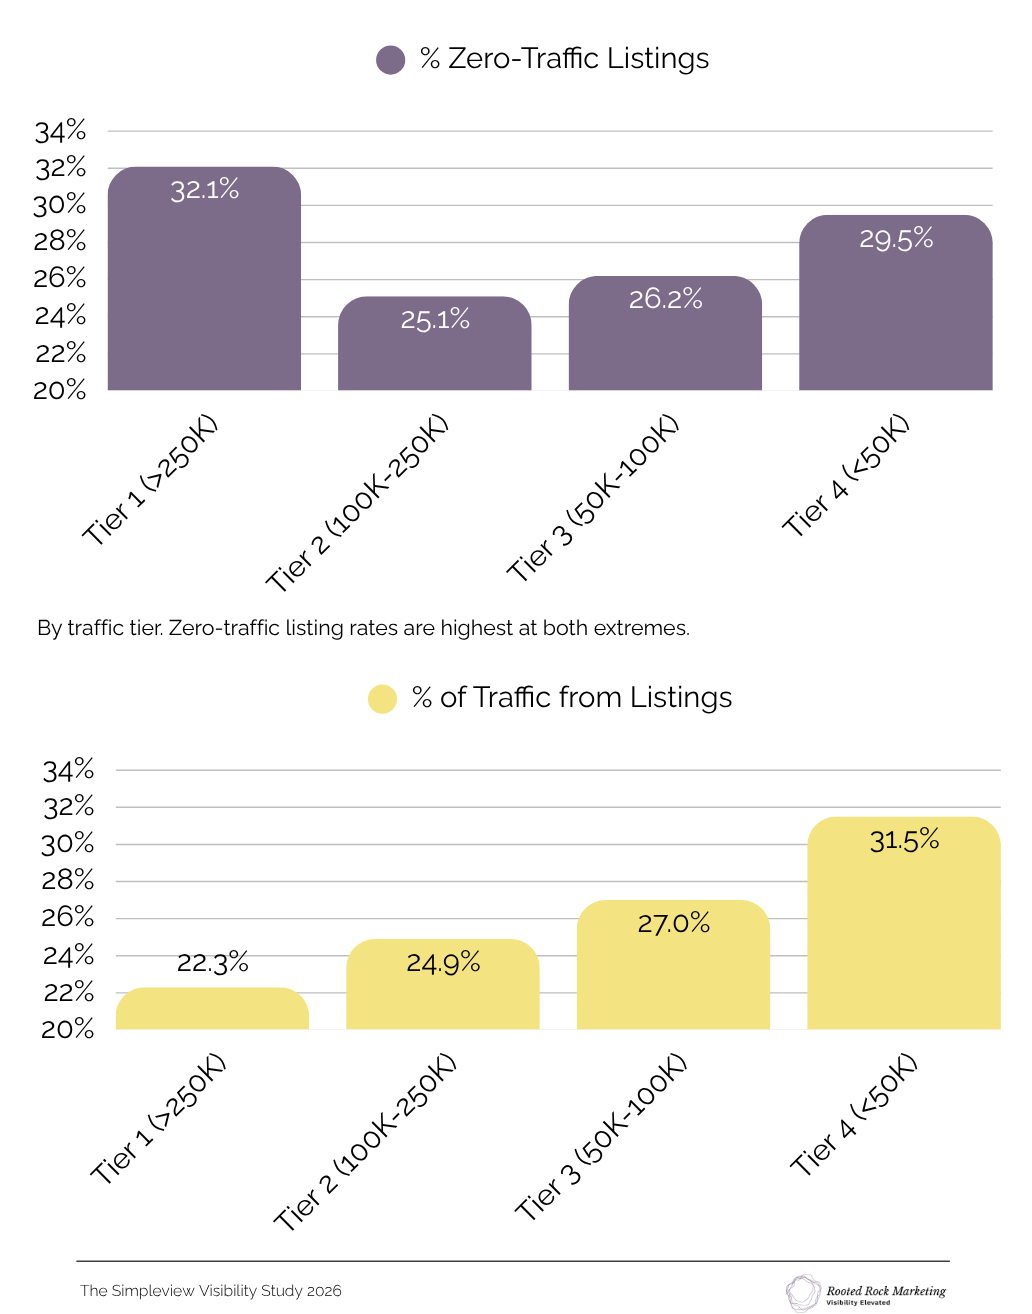
Larger Sites Struggle Most
Zero-traffic listing rates are highest among Tier 1 sites — the largest destinations in the study — at 32.1%. Tier 1 sites also average 3,540 listing pages, nearly five times the Tier 4 average of 716, which may contribute to the challenge of maintaining consistent content quality across the full catalog.
Smaller DMOs are more dependent on listings for their overall traffic — listings drive 31.5% of Tier 4 traffic vs. 22.3% for Tier 1. This makes listing quality even more critical for smaller organizations with fewer editorial resources.
What Separates Well-Performing Listings From Invisible Ones?
The range across the dataset is wide, with some sites seeing listings drive over 50% of their traffic, while others barely reach 5%. The disparity suggests that factors beyond platform architecture and market size are at play, and that there is meaningful room for improvement across the ecosystem regardless of destination size.
The Blog Opportunity
Smaller Footprint, Higher Return — and Most of it Untapped
Blog content represents just over 10% of pages on a typical Simpleview site — 30,588 blog pages across 100 sites analyzed, which comes to just about one blog post for every five listing pages. For many DMOs, blog content exists to give visitors a reason to come to the site before moving them toward listings and partner pages.
No matter how useful a blog's content may be, it only moves visitors toward listings if it's actually findable in search.
Large DMOs Enjoy a Significant Advantage
DMOs with larger, higher-traffic sites earn dramatically more visits per blog page and have significantly lower zero-traffic rates, suggesting their blog content is working harder, not just existing.
The top 10 sites by blog traffic share earn an average of 90.3 visits per blog page and have a zero-traffic rate of 38.2% — compared to 6.9 visits per page and 60.6% zero-traffic for the bottom 10. What distinguishes high performers is not fully captured in this dataset; content depth, keyword strategy, and editorial consistency are likely contributing factors that warrant further study.
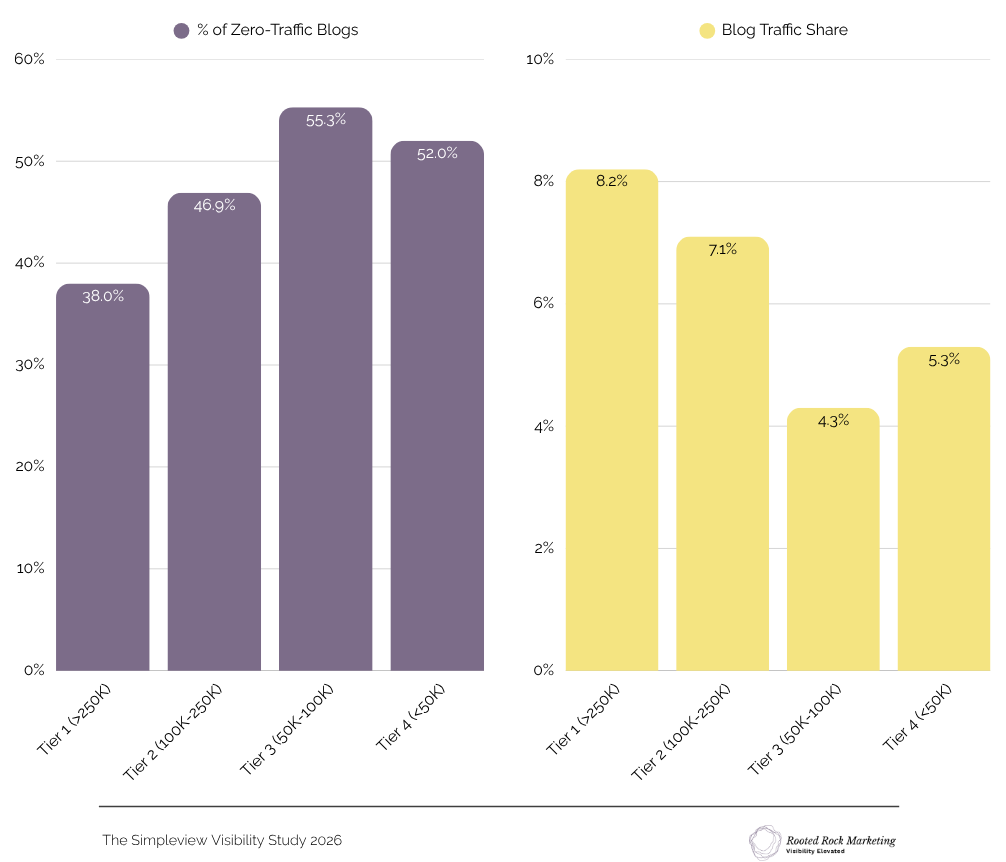
While blog content is one of the highest-return content types on a Simpleview site, it needs to be done well to truly earn its place. The data shows that the gap between high and low blog performers is large — 13x in visits per page — and that this gap exists independently of overall site size.
For smaller DMOs or those with limited resources, this is good news. The key to success isn't to publish more — but rather to publish with purpose.
The Mid-Size Exception Worth Noting
When measured by raw traffic, the top performers are almost exclusively large or statewide destinations. Blog efficiency, however, tells a different story. One mid-size Midwest city DMO ranks among the top five for visits per blog page, earning over 157 monthly visits per post, with a zero-traffic blog rate of just 21% — among the lowest in the entire study. The data makes a clear case that smaller DMOs can compete with larger destinations on blog performance; fewer wasted pages and higher return on each post published are not the exclusive domain of big-budget operations.
AI Visibility
An Emerging Frontier Where DMOs Are Still Finding Their Footing
Using SEMrush's AI Visibility Score — a metric that scores a domain's presence in AI-generated search answers — we measured AI visibility as part of this study. The AI picture that emerged was one of an industry in its early stages: scores are generally low across the board, but the gap between leaders and laggards is already significant. The good news is that the window to establish AI authority is still very much open.
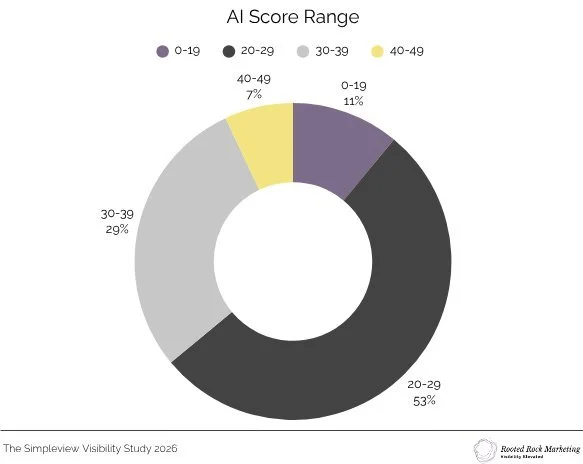
The Majority of Sites Fall Within a Narrow — and Low — Range
Of the 100 sites studied, 53 scored between 20 and 29 — a tight cluster in the lower third of the 0 to 100 scale. Only 7 sites scored above 40, and none exceeded 49, suggesting the strongest performers in this category still have significant room to grow.
The Strategic Implication
We found a meaningful positive correlation between AI Visibility Score and organic traffic (r = 0.57), suggesting that the habits that contribute to strong traditional search performance also appear to reinforce AI visibility. The relationship is not one-to-one, however, which makes it all the more interesting.
One mid-size Texas-area destination scored 49 — the highest in the entire study — outpacing state tourism boards and major metropolitan destinations with many times its organic traffic. AI visibility appears to reward content authority and citation presence, not just overall site scale.
The traffic-weighted average AI score (33.6) is meaningfully higher than the simple average (28.1), which tells us that larger destinations tend to have better AI visibility. But our study also shows that a focused mid-size DMO can compete with and outperform larger destinations.
Who Appears Alongside DMOs in AI-Generated Answers
Top co-cited sources — domains that appear most frequently in AI-generated answers that also mention each destination — were found to be fairly consistent across sites studied. Facebook and TripAdvisor are by far the most dominant; at least one of the two appeared in AI-generated answers for 97 of the 100 sites studied.
Note: These are co-citations — sources that appear in AI answers that also mention the destination, not sources that replace the DMO's own presence.
- facebook.com86 of 100 DMOs
- tripadvisor.com79 of 100 DMOs
- youtube.com39 of 100 DMOs
- yelp.com17 of 100 DMOs
- wikipedia.org10 of 100 DMOs
Market Size Isn't Destiny
Strategy Beats Population
A common assumption is that destination market size — measured by metro area population — is a strong predictor of organic search performance. The data tells a far more nuanced story.
Market size accounts for just 10.6% of the variation in organic traffic across these 100 DMO sites, which means that nearly 90% is explained by factors other than market size.
Average Traffic by Market Size
Based on 83 non-statewide DMOs. Statewide tourism boards were excluded from this analysis because state populations are not comparable to metro-area populations for market-size benchmarking.
| Market Size (MSA Population) | Avg Monthly Organic Traffic | Sites in Study |
|---|---|---|
| Small (<200K) | 77,525 | 20 |
| Mid-Small (200K–500K) | 115,230 | 20 |
| Mid-Large (500K–1.5M) | 178,670 | 23 |
| Large (1.5M–5M) | 275,140 | 20 |
The implication for smaller and mid-size DMOs
Among the 83 non-statewide destinations, fifteen sites generate more than twice the traffic their market size would predict. Eighteen generate less than half.
Market size explains only 10.6% of the variation in organic traffic across these sites. The vast majority of what separates high performers from low performers lies elsewhere.
Identifying exactly what drives that gap would require a deeper content and technical audit, but the data is clear that geography alone is not the constraint.
Top Performers
What the Best Performing Sites Have in Common
Rather than ranking destinations by a single metric, we looked at performance across six dimensions.
Overall Organic Traffic
Blog Efficiency
AI Visibility Score
Keyword Footprint
Listing Efficiency
Market Overperformance
Two destinations appear in the top 10 across all six — the best-performing Simpleview sites are not optimized for just one thing; they are well-rounded across every dimension of search visibility we measured.
Performance by Dimension
What Top Performers Share
- Low zero-traffic rates on both listings and blogs — a pattern consistent with intentional content strategy and ongoing maintenance
- AI visibility that outpaces their traffic rank — suggesting content characteristics that AI systems find referenceable
- Broad keyword coverage relative to page count — an indicator of content depth and topical authority
- Balance across content types — listings driving partner visibility, blogs capturing travel-planning queries, and funneling visitors toward listings
Opportunities
Where the Data Points to Action
The findings in this study point to five areas where Simpleview-powered DMOs have an opportunity to improve organic search and AI visibility. The challenges addressed by these recommendations were found consistently across all market sizes and traffic tiers.
Audit Your Zero-Traffic Listings — and Address What You Find
Across 100 sites, an average of 463 listing pages per site receive zero organic traffic. These pages consume crawl budget, dilute keyword relevance signals, and deliver no value to partners or visitors. 46,310 listing pages — 28.7% of all listings across the study — receive zero organic traffic. The problem is consistent across every traffic tier.
- Identify zero-traffic listing pages.
- Prioritize pages with thin content — improve descriptions, add photos, expand details.
- Consider whether consolidating or removing very low-value listings improves overall crawl efficiency.
Treat Blog Content as the Engine That Supports Listings — and Optimize Accordingly
For many DMOs, blog content exists to bring visitors into the site and move them toward listings and partner pages. That function only works when blog pages are findable in search. With 46.1% of blog pages receiving zero organic traffic, nearly half of that engine is not running.
Blog pages generate 1.6x more organic traffic per page than listing pages. Sites with low zero-traffic rates on both blogs and listings average 1.7x overall traffic. Correlation does not necessarily imply causation.
- Audit existing blog content for keyword targeting.
- Prioritize editorial guides that naturally link to multiple listings.
- Refresh underperforming posts before publishing new ones.
Invest in AI Visibility Before the Window Closes
Only 1.3% of destination-related queries currently trigger a Google AI Overview, but this is likely only temporary. The habits that build strong traditional search performance also appear to reinforce AI visibility (r = 0.57 correlation between AI Visibility Score and organic traffic).
Average AI Visibility Score across 100 sites is 28.1 out of 100. No site exceeded 49. The entire category has room to grow, which means the gap between early movers and laggards has not yet closed.
- Focus on creating structured, authoritative content — the same habits that correlate with strong organic performance also appear to reinforce AI visibility.
- Maintain an active presence on frequently co-cited platforms — Facebook, TripAdvisor, and YouTube appeared alongside DMO content in AI answers for the majority of sites studied.
- Monitor AI Visibility Score regularly as a leading indicator of how AI search perceives your destination.
Don't Let Market Size Set Your Expectations
Market size explains only 10.6% of the variation in organic traffic across these DMO sites. Among the 83 non-statewide destinations, fifteen sites generate more than twice the traffic their market size would predict. Eighteen generate less than half.
r = 0.33 correlation between MSA population and organic traffic. R² = 10.6%, meaning 89.4% of traffic variance is explained by factors other than market size.
- Benchmark against destinations of similar content investment, not just similar market size.
- Use actual vs. expected traffic ratio as an internal KPI alongside raw traffic numbers.
- Identify what the overperformers in your tier are doing differently — the data shows the gap is closeable.
Measure What Matters — and Connect It to Partner Value
DMOs often measure listing click-outs as a primary KPI. Organic traffic is one of the primary ways visitors discover listing pages — and 28.7% of listing pages are generating none of it.
Listing pages that receive no organic traffic are missing out on one of the primary pathways through which visitors discover and click out to partners. The 28.7% of listings with zero organic traffic represent a significant gap in potential partner value delivery.
- Report on listing-level organic traffic alongside click-out data, not just aggregate site traffic.
- Identify which partner categories have the highest zero-traffic listing rates.
- Use zero-traffic listing rate as a KPI in annual content audits.
These recommendations apply across all destination sizes. The data shows no tier where these challenges don't exist — and no tier where meaningful improvement isn't possible.
The Visibility Gap Is Real — and Closeable
The Simpleview platform gives destination marketing organizations a powerful foundation. It provides a content management system purpose-built for DMOs, a structured listing architecture that surfaces partner businesses, and the tools to build a comprehensive destination website. What this study reveals is the gap between that foundation and how well it is currently being used by the majority of sites reviewed.
Across 100 Simpleview sites, the patterns are consistent enough to be considered industry-wide:
- More than half of all pages on a typical site are listings, and yet listings generate less than a quarter of organic traffic.
- Nearly three in ten listing pages receive no organic traffic at all.
- Almost half of all blog pages are invisible in search.
- AI visibility scores cluster in the bottom third of a 100-point scale, with no site reaching 50.
- Market size explains barely one tenth of the variation in performance.
This isn't a platform problem. Simpleview provides the infrastructure, but the data consistently points to a gap in content strategy.
The destinations that perform best in this study are not necessarily the largest or the best-resourced. They are the ones that treat search visibility as an ongoing discipline rather than a configuration decision.
The AI Visibility Findings Add a Forward-Looking Dimension
With only 1.3% of destination queries currently triggering AI-generated answers, the category is still in its early stages. Because the habits that build strong traditional search performance also appear to reinforce AI visibility, the DMOs that invest in those fundamentals now are building an asset that will compound as AI search continues to evolve.
This study represents a starting point, not a complete picture. Events pages — an equally important content type for DMOs — were intentionally excluded from this analysis and warrant their own dedicated research. In addition, the AI visibility landscape will look meaningfully different in twelve months than it does today.
What this study does establish, for the first time with independent data, is a baseline: 100 sites. 300,000 pages. Nearly 20 million monthly organic visits. And a clear, consistent signal that the gap between where Simpleview destinations are and where they could be is not a function of market size, platform capability, or destination type. It is a function of content strategy — and content strategy is something every DMO controls.
How This Study Was Conducted
This study analyzed 100 destination marketing organization websites built on the Simpleview CMS, to establish an independent, data-driven baseline for how Simpleview-powered sites perform in organic search and AI-driven discovery.
Site Identification and Verification
Candidate sites were identified using a combination of AI research tools and BuiltWith.com, then manually reviewed to confirm an active Simpleview CMS deployment. Verification was performed by identifying the "Made by Simpleview" attribution in the site footer or by examining the site's source code. Sites that used the Simpleview CRM or API feed only — without the CMS — were excluded.
Data Collection
Data was collected across four source types:
- SEMrush domain and subfolder analysis — organic traffic, keywords, SERP features, AI Visibility Score, and citation data for the full domain and relevant content subfolders
- Zero-traffic page counts — collected using SEMrush's Pages report filtered to zero traffic, for both listing and blog subfolders
- Sitemap analysis — total page counts collected from each site's sitemap.xml, with listing and blog pages identified using each site's specific URL structure (which varied across sites)
- Market size data — MSA population from the 2020 U.S. Census; Nielsen DMA rankings from the 2024–25 season
Site Segmentation
| Tier | Monthly Organic Traffic | Sites in Study | Description |
|---|---|---|---|
| Tier 1 | > 250,000 | 20 | Major state tourism boards and large metro destinations |
| Tier 2 | 100,000–250,000 | 36 | Regional hubs with strong search presence |
| Tier 3 | 50,000–100,000 | 23 | Mid-size destinations with established visibility |
| Tier 4 | < 50,000 | 21 | Smaller and emerging destinations |
Scope & Limitations
Events pages were intentionally excluded. Events represent a significant content type on most Simpleview sites and are equally important to DMO search strategy. The decision to exclude them was made to keep the scope of this study focused on listing and blog content, where the architectural patterns of Simpleview sites are most consistent and comparable across destinations. Events page performance warrants its own dedicated analysis.
All traffic and keyword figures are third-party estimates. SEMrush estimates organic traffic based on keyword rankings and modeled click-through rates — not direct measurement. Figures should be read as directional indicators rather than precise counts.
Aggregate figures use summed totals, not averaged percentages. All percentage metrics reported at the study level were calculated by summing raw values across all 100 sites and dividing, not by averaging site-level percentages, which would introduce statistical bias.
Correlations do not imply causation. Where correlation coefficients are reported, these describe statistical relationships in the dataset only.
Statewide tourism boards were excluded from market size analysis. Seventeen of the 100 sites in this study are statewide tourism boards. Because state populations are not comparable to metro area populations, these sites were excluded from the Average Traffic by Market Size table and from the market size correlation analysis. They are included in all other findings throughout the study.
Destination anonymization. Individual sites are not identified by name in the findings sections of this report. Destinations are described by tier, region, and general market characteristics only.
Data was collected in March and April 2026. All findings reflect conditions at the time of collection.
To measure the relationship between market size and organic traffic, we calculated the correlation between MSA population and organic traffic across the 83 non-statewide sites in this study. The R² value of 0.106 tells us that 10.6% of the variation in organic traffic between sites can be statistically attributed to market size. The remaining 89.4% is driven by other factors.
Definitions Used
- AI Overview
- A feature in Google Search that displays an AI-generated summary answer at the top of search results for certain queries. The "% AI Overview" metric in this study reflects the share of a site's ranking keywords for which Google shows an AI Overview.
- AI Visibility Score
- A metric from SEMrush that scores a domain's presence in AI-generated search answers on a scale of 0 to 100. A higher score indicates the domain appears more frequently as a source or reference in AI-generated responses. This metric is relatively new and should be interpreted as a directional indicator of AI search presence rather than a definitive measure.
- Blog Pages
- Editorial content pages on a Simpleview site — guides, articles, itineraries, and destination stories. Blog pages were identified using each site's sitemap and subfolder structure, which varied across sites. Blog indexation was measured using each site's specific article URL pattern to avoid inflation from category, tag, and pagination pages.
- Co-Cited Sources
- Domains that frequently appear alongside a given site in AI-generated search answers. In this study, co-cited sources were identified using SEMrush's "Top Cited Sources" report. These are sources that appear with the DMO — not instead of it.
- DMA (Designated Market Area)
- A geographic region defined by Nielsen for television audience measurement, used in this study for the media market context. DMA rankings reflect the 2024–25 Nielsen season. Smaller DMA rank numbers indicate larger markets (e.g. DMA #1 is New York).
- Listing Pages
- Pages on a Simpleview site that describe individual partner businesses, attractions, restaurants, accommodations, or services. Listing pages were identified and counted using each site's sitemap and subfolder-level analysis. URL structures varied across sites and were confirmed individually during data collection.
- MSA (Metropolitan Statistical Area)
- A U.S. Census Bureau designation for a core urban area and its surrounding communities, used in this study as a proxy for destination market size. Population figures are from the 2020 U.S. Census.
- Organic Traffic
- Visits to a website that originate from unpaid search engine results. All organic traffic figures in this study are SEMrush estimates based on keyword rankings and modeled click-through rates. They will differ from actual figures in Google Analytics or Google Search Console.
- Performance Ratio
- In the market size analysis, the ratio of a site's actual organic traffic to its statistically expected traffic given its MSA population. A ratio above 1.0 indicates a site generating more traffic than its market size alone would predict.
- Traffic-Weighted Average
- An average calculated by weighting each site's value by its share of total traffic, rather than treating all sites equally. Used for metrics like AI Visibility Score and SERP distribution, where larger sites would otherwise be underrepresented.
- Zero-Traffic Pages
- Pages that receive zero estimated organic visits in a given month, as reported by SEMrush's Pages report. A zero-traffic page is not necessarily unindexed — it may rank too low to receive meaningful clicks, or rank only for queries with very low search volume.